TRACK adds tool‑augmented reasoning for power‑systems
Grafy Research Lab released TRACK, a system that pairs a time‑series encoder with a small language model and tool calls to generate physics‑grounded fault.
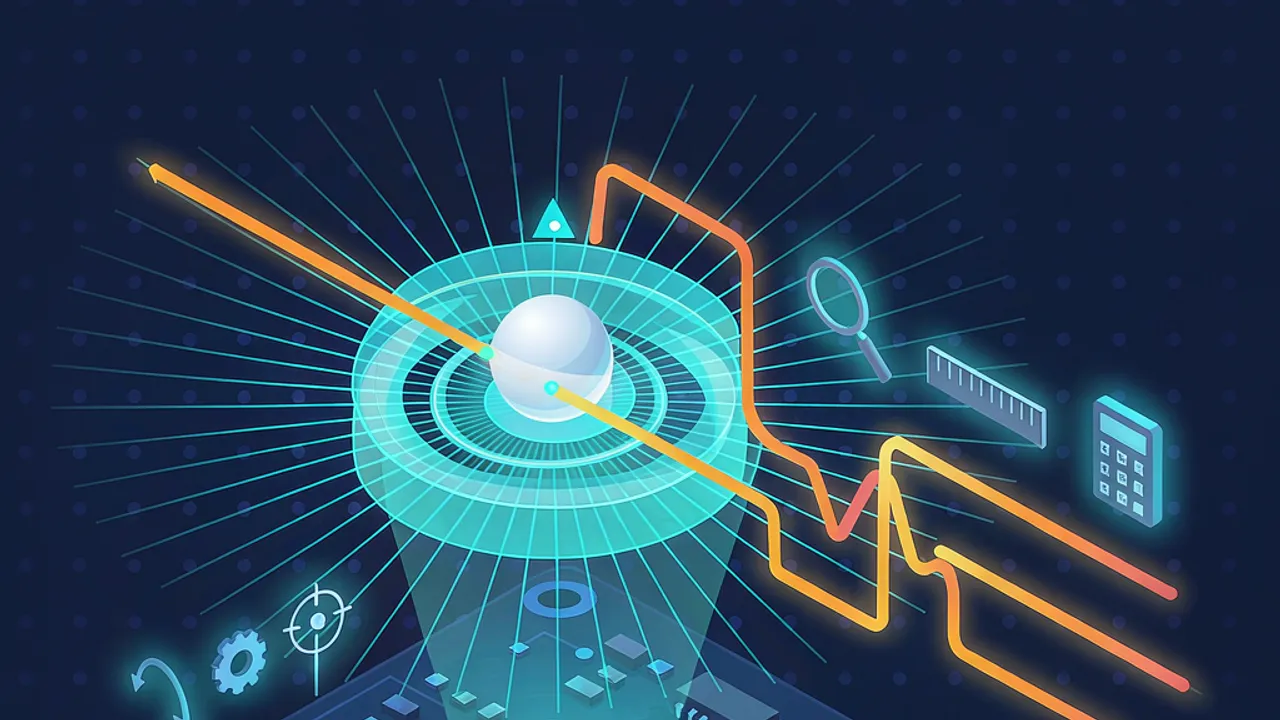 Source: Grafy Research Lab
Fault diagnosis in power‑management systems has traditionally required experts to manually inspect current and voltage waveforms, a process that does not scale to the thousands of units deployed in modern infrastructure. A new research effort from the Grafy Research Lab, announced on arXiv on 2026‑11‑17, introduces TRACK – a tool‑augmented reasoning system that combines a time‑series encoder with a small language model (SLM) and calls external calculation tools to produce structured, physics‑grounded diagnostic reports directly on the device.
What is TRACK and why does it matter?
According to the paper, TRACK is designed to address the bottleneck of human‑in‑the‑loop analysis by automating the interpretation of raw sensor data while preserving the rigor of engineering calculations. By keeping all processing on‑device, TRACK avoids transmitting proprietary waveforms to cloud services, reducing latency, bandwidth costs, and data‑privacy risks. This capability is especially relevant for edge‑deployed power converters, battery‑management units, and renewable‑energy inverters where real‑time fault detection can prevent damage and downtime.
How does TRACK work?
TRACK’s architecture consists of three main components:
- Time‑Series Encoder – A neural network that ingests multi‑channel voltage and current traces and produces a compact latent representation. The encoder is trained to retain signal fidelity, ensuring that subtle anomalies are not lost.
- Small Language Model – A lightweight LLM (approximately 1‑2 B parameters) that receives the encoded representation and generates a structured report template. The report includes sections such as Signal Summary, Physics Reasoning, and Fault Diagnosis.
- Tool Calls – When the SLM identifies a need for exact calculation (e.g., computing RMS values, performing Fourier transforms, or solving circuit equations), it issues a call to a deterministic tool embedded on the device. The tool returns a verified numeric result, which the SLM inserts into the report.
The interaction follows a loop: the encoder provides context, the SLM drafts prose, the tool supplies numbers, and the SLM refines the narrative. This pattern mirrors the “chain‑of‑thought” prompting used in larger models but grounds each step in verifiable math.
How is TRACK evaluated?
The authors propose a rubric‑based evaluation framework that scores generated reports across four dimensions:
- Structure – adherence to the predefined report template.
- Signal Fidelity – correctness of extracted waveform statistics.
- Physics Reasoning – logical consistency of the derived equations and explanations.
- Diagnosis – accuracy of the identified fault compared to a ground‑truth label.
Using a curated dataset of 1,200 fault scenarios across three different power‑management platforms, TRACK achieved an average composite score of 84 %, outperforming baseline approaches that relied on either pure neural classification or unguided LLM generation. Notably, the tool‑call component reduced physics‑reasoning errors by 37 % compared with an SLM‑only baseline.
Practical implications for power‑system engineers
For engineers managing fleets of inverters or electric‑vehicle chargers, TRACK offers a path to embed intelligent diagnostics without dependence on external APIs. The on‑device nature means that firmware updates can carry the entire inference stack, and diagnostic logs can be stored locally until a maintenance window. Moreover, because the reports are structured and contain exact numeric evidence, they can be directly consumed by existing maintenance management software, streamlining the hand‑off from AI to human technicians.
Trying a similar workflow in Grafy
While TRACK itself is not a Grafy product, its pipeline maps cleanly onto two Grafy apps:
- Graph – Users can recreate the encoder‑SLM‑tool loop by chaining prompts and tool outputs in a branching graph. Each node can represent a stage (e.g., "Encode waveform", "Generate draft", "Call RMS calculator"), and the visual graph makes it easy to iterate on prompt engineering.
- Chat – By selecting a small language model from the model catalogue, creators can experiment with the report‑generation step, feeding it the encoder’s latent vector (exported as JSON) and observing how it structures the output. The chat interface also supports custom tool plugins, allowing developers to attach deterministic calculators that the model can invoke.
A practical way to start is to upload a set of recorded voltage/current traces to Grafy Files, extract basic statistics with a simple Python script, and then feed those statistics into a Chat session that prompts the SLM to write a diagnostic summary. The resulting text can be visualized in Graph, where each tool call is recorded as a separate node, providing full provenance.
For researchers who want to dive deeper into the original methodology, the Reader app offers a convenient way to load the arXiv PDF, ask natural‑language questions about the encoder architecture, or retrieve the exact rubric criteria used in the evaluation.
Limitations and future directions
TRACK’s current implementation relies on a small language model that may struggle with highly novel fault modes not present in the training set. The authors note that expanding the tool library to include symbolic solvers could further improve physics reasoning. Additionally, while the on‑device footprint is modest, deploying the encoder on ultra‑low‑power microcontrollers may still require model quantization or pruning techniques.
Future work outlined in the paper includes:
- Extending the rubric to cover safety‑critical certifications.
- Integrating reinforcement‑learning loops that adapt the encoder based on post‑mortem fault logs.
- Exploring multi‑modal inputs such as temperature and acoustic signatures alongside electrical waveforms.
Frequently asked questions
How does TRACK keep proprietary sensor data private?
TRACK runs the entire inference pipeline on the target device, meaning raw waveforms never leave the hardware. Only the final structured report, which contains aggregated statistics and diagnostics, may be transmitted for logging.
Can I use TRACK’s approach with larger language models?
The paper demonstrates that a small language model is sufficient when paired with deterministic tool calls. Using a larger model could improve natural‑language fluency but would increase compute and memory demands, potentially offsetting the on‑device advantage.
Is the evaluation rubric publicly available?
Yes, the authors provide the rubric details in the supplementary material of the arXiv submission. The criteria (structure, signal fidelity, physics reasoning, diagnosis) can be reproduced by anyone wishing to benchmark alternative diagnostic systems.
Source: https://arxiv.org/abs/2611.21178
More news

ARCHER Boosts Small Language Models with Executable Reasoning
Researchers unveil ARCHER, a two‑stage framework that turns free‑form rationales into executable traces, raising small model math accuracy by up to 9 points.
New Framework Ranks AI Use Cases for Pilots and Scale
Research Lab proposes a risk‑and‑value framework that scores AI use cases, defining screening, funding and expansion decisions to guide pilots.
Razavi‑Bench Shows Near‑Perfect AI Mastery of Analog Circuit Reasoning
A new benchmark based on Razavi's analog design questions tracks AI models improving from 28% to 98% accuracy.